Das hier ist eine Materialsammlung zum Thema Sonnenflecken und Temperatur. Es gibt noch keinen zusammenfassenden Artikel, ist aber bestimmt interessant zum Stöbern.
Gleich zuerst mal die Sonnenzyklen und die ca. 10-11 Jahre später folgenden Temperaturzyklen . Die PMO hat auch was zu tun damit.
http://www.woodfortrees.org/plot/hadcrut3vgl/mean:12/from:1900/offset:0.5/plot/esrl-amo/from:1900/mean:12/plot/sidc-ssn/from:1890/mean:12/normalise/scale:0.7/offset:-0.5/plot/hadcrut3vgl/from:1943/to:1955/mean:12/offset:0.5/plot/hadcrut3vgl/from:1964/to:1977/mean:12/offset:0.5/plot/hadcrut3vgl/from:1984/to:1997/mean:12/offset:0.5/plot/hadcrut4gl/from:2008/offset:0.45/plot/hadcrut3vgl/from:1922/to:1934/mean:12/offset:0.5/plot/hadcrut3vgl/from:1903.5/to:1913.5/mean:12/offset:0.5
http://www.woodfortrees.org/plot/hadcrut3vgl/mean:12/from:1940/offset:0.5/plot/esrl-amo/from:1940/mean:12/plot/sidc-ssn/from:1930/mean:12/normalise/scale:0.7/offset:-0.5/plot/hadcrut3vgl/from:1943/to:1955/mean:12/offset:0.5/plot/hadcrut3vgl/from:1964/to:1977/mean:12/offset:0.5/plot/hadcrut3vgl/from:1984/to:1997/mean:12/offset:0.5/plot/hadcrut4gl/from:2008/offset:0.45
Zitat aus Wikipedia
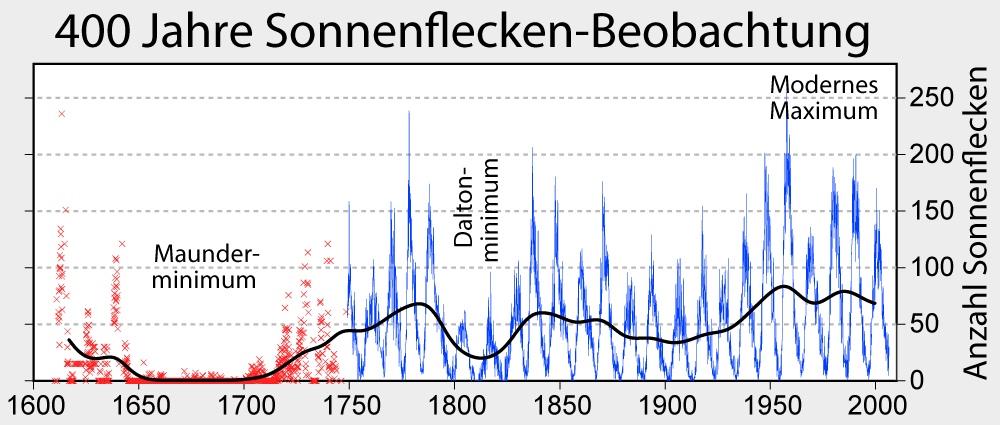
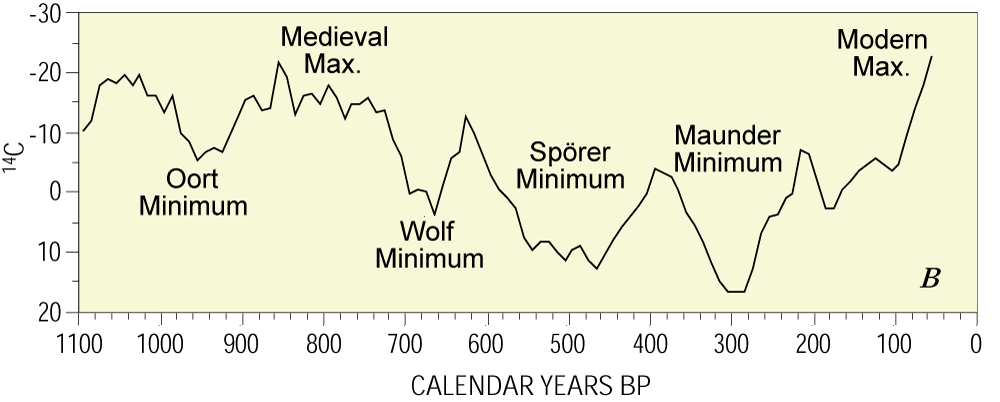
Der 11-jährliche Sonnenfleckenzyklus ist nicht exakt regelmäßig. Obwohl der Durchschnittswert 11,04 Jahre beträgt, treten auch Zyklen von 9 bis 14 Jahren auf. Auch der Durchschnittswert variiert über die Jahrhunderte – die Sonnenzyklen im 20. Jahrhundert waren zum Beispiel mit 10,2 Jahren im Durchschnitt kürzer als die der vergangenen Jahrhunderte. Der Verlauf des Maunderminimums und weiterer Minima legt eine Variation der Gesamtintensität der Sonne auf einer Zeitskala von mehreren 100 Jahren nahe. Aus der 10Be-Verteilung im Grönlandeis schließt man auf mehr als 20 Sonnenminima innerhalb der letzten 10.000 Jahre.[3]
Auch der Verlauf des Zyklus selbst ist nicht konstant. So erklärte der Schweizer Astronom Max Waldmeier, dass der Übergang vom Minimum zum Maximum der Sonnenaktivität umso schneller erfolgt, je höher das Maximum sein wird. Im Gegensatz zum steilen Anstieg nimmt die Anzahl der Sonnenflecken bei solchen Zyklen jedoch nur langsam ab.
Bei Zyklen mit geringer maximaler Anzahl an Sonnenflecken ist die Phase des Ansteigens und des Abfallens in etwa gleich lang.
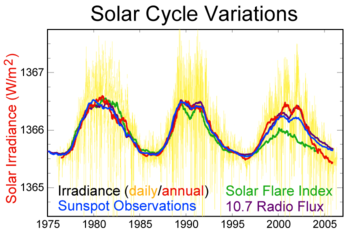
http://upload.wikimedia.org/wikipedia/commons/thumb/0/0d/Solar-cycle-data.png/525px-Solar-cycle-data.png

mehr Informationen auf Englisch hier:
http://commons.wikimedia.org/wiki/File:Solar-cycle-data-German.png
This picture depicts the last three solar cycles as measured in solar irradiance, sunspot numbers, solar flareactivity, and 10.7 cm radio flux. Solar irradiance, i.e the direct solar power at the top of the Earth's atmosphere, is depicted as both a daily measurement and a moving annual average. All other data are depicted as the annual average value.
The ~11 year solar magnetic cycle is a fundemental aspect of the sun's behavior and is associated with variations in total output and activity. Irradiance measurements have only been available during the last three cycles and are based on a composite of many different observing satellites. [1] However, the high correlation between irradiance measurements and other proxies of solar activity make it reasonable to estimate past solar activity. Most important among these proxies is the record of sunspot observations that has been recorded since ~1610. Since sunspots and associated faculae are directly responsible for small changes in the brightness of the sun, they are closely correlated to changes in solar output. Direct measurements of radio emissions from the sun also provide a proxy of solar activity that can be measured from the ground since such solar radiation is not substantially affected by the atmosphere. Lastly, solar flares are a type of solar activity that can impact life onEarth by affecting electrical systems, especially satellites. Flares only occur in the presence of sunspots, and hence the two are correlated, but flares are not directly tied to total solar luminosity.
Recently, it appears that solar irradiance is varying in ways that aren't duplicated by changes in sunspot observations or radio emissions.
>>> Die solare Einstrahlung stimmt also nicht mit den Sonnenflecken überein. Wie wäre es mit einem Vergleich mit dem darauffolgenden? Siehe oben: Der grüne Graph (Sonneneruptionen) wiederholt sich im nächsten Zyklus in rot (Solare Einstrahlung (Intensität des Sonnenlichts). und der grüne Graph im letzten (2000er) Zyklkus weist einen genauso schwachen Ausschlag auf wie der darauffogende 2010er Zyklus (nicht im Bild).
However, this conclusion is disputed. Some believe that shifts in irradiance may be the result of calibration problems in the measuring satellites.[1][2] These speculations also admit the possibility that a small long term trend might exist in solar irradiance, though the data chosen for this plot do not have a significant trend.[3] Also, the differences in flare activity over the three cycles would not be related to possible measurement artifacts in irradiance.
With respect to global warming, though solar activity has been at relatively high levels during the recent period, the fact that solar activity has been near constant during the last 30 years precludes solar variability from playing a large role in recent warming. It is estimated that the resdiual effects of the prolonged high solar activity account for between 18 and 36% of warming from 1950 to 1999.[4]
Eckwerte der letzten Sonnenzyklen
Zyklus-Nummer, Beginn: Jahr-Monat, Maximum: Jahr-Monat, Sonnenfleckenrelativzahl[5]
18 1944-02 1947-05 201
19 1954-04 1957-10 254
20 1964-10 1968-03 125
21 1976-06 1979-01 167
22 1986-09 1989-02 165
23 1996-09 2000-03 139
24 2008-01[6]2014-02 102

http://upload.wikimedia.org/wikipedia/commons/d/d7/Sunspot_Numbers_German.png

http://de.wikipedia.org/wiki/Sonnenfleck#mediaviewer/File:Sunspots_11000_years.svg

http://commons.wikimedia.org/wiki/File:Solar_Activity_Proxies.png

Keine Kommentare:
Kommentar veröffentlichen